Anika Jain
Introduction
I’m going to show few graphs and plots. It was fun exausting myself and work whole night. I get it that i still suck at it. Duh I think i’ll try to get better at this and keep practicing as the outcome of the chunks are pretty cool.
Graph 1
I used geom_sf to make the graph of Jaipur City, it was more fun than i expected. The way graph came up looked satisfying.
bbox_jaipur <- getbb("Jaipur, India")
dat_jaipur_H <- extract_osm_objects(bbox_jaipur, "highway")
## Issuing query to Overpass API ...## Rate limit: 2## Query complete!## converting OSM data to sf formatdat_jaipur_B <- extract_osm_objects(bbox_jaipur, "building")## Issuing query to Overpass API ...## Rate limit: 2## Query complete!## converting OSM data to sf formatdat_jaipur_R <- extract_osm_objects(bbox = bbox_jaipur, key = "amenity", value = "restaurant", return_type = "point")## Issuing query to Overpass API ...## Rate limit: 2## Query complete!## converting OSM data to sf format## Using geom_sf()
ggplot() +
geom_sf(data = dat_jaipur_H, colour = "dodger blue") +
geom_sf(data = dat_jaipur_B, fill = "orange") +
geom_sf(data = dat_jaipur_R, colour = "Yellow", fill = "red") +
theme(panel.background = element_rect(fill = "palegreen")) +
labs(title = "Pink City is not so pink anymore", subtitle = "food is everywhere")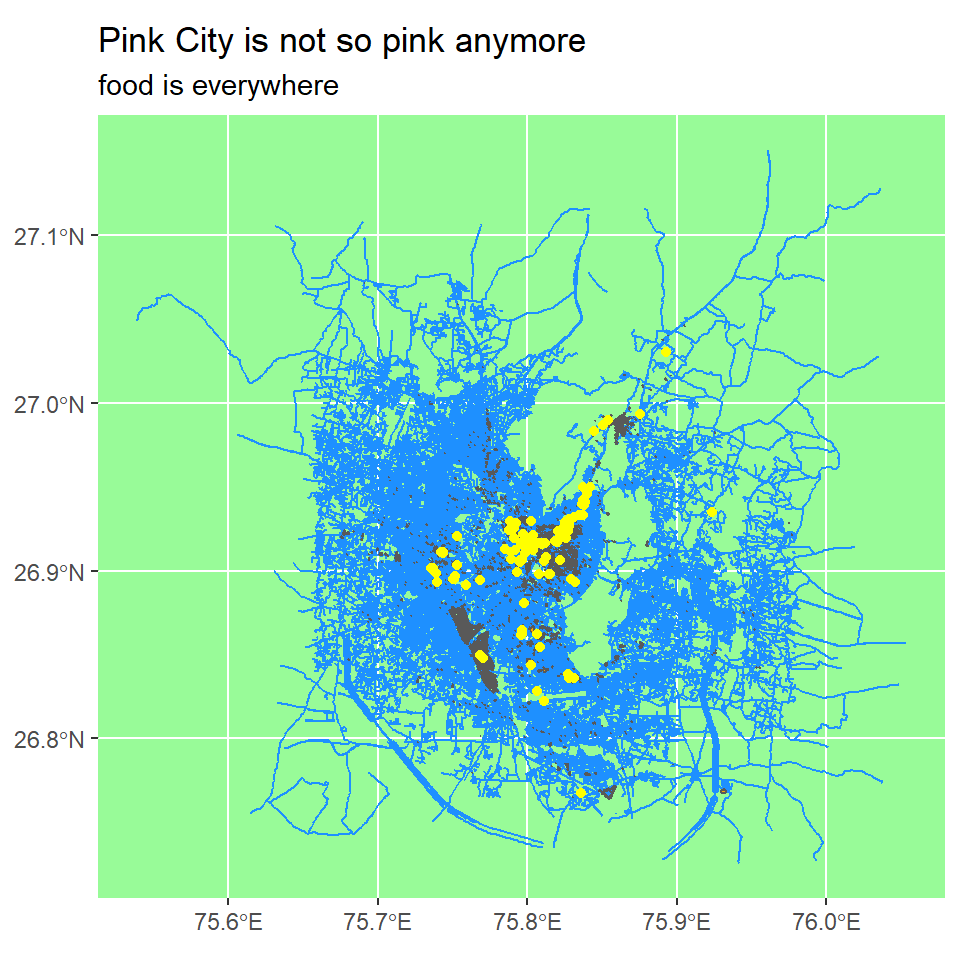
Graph 2
This graph is about the sleeping patterns of mammals. I used ggplot to make the graph. The fun part about the graph is, it’s also sleeping the way I want to.
ggplot(msleep) +
    geom_density(aes(y = sleep_total,
                 color = vore,
                 fill = vore),
                 alpha = 0.5)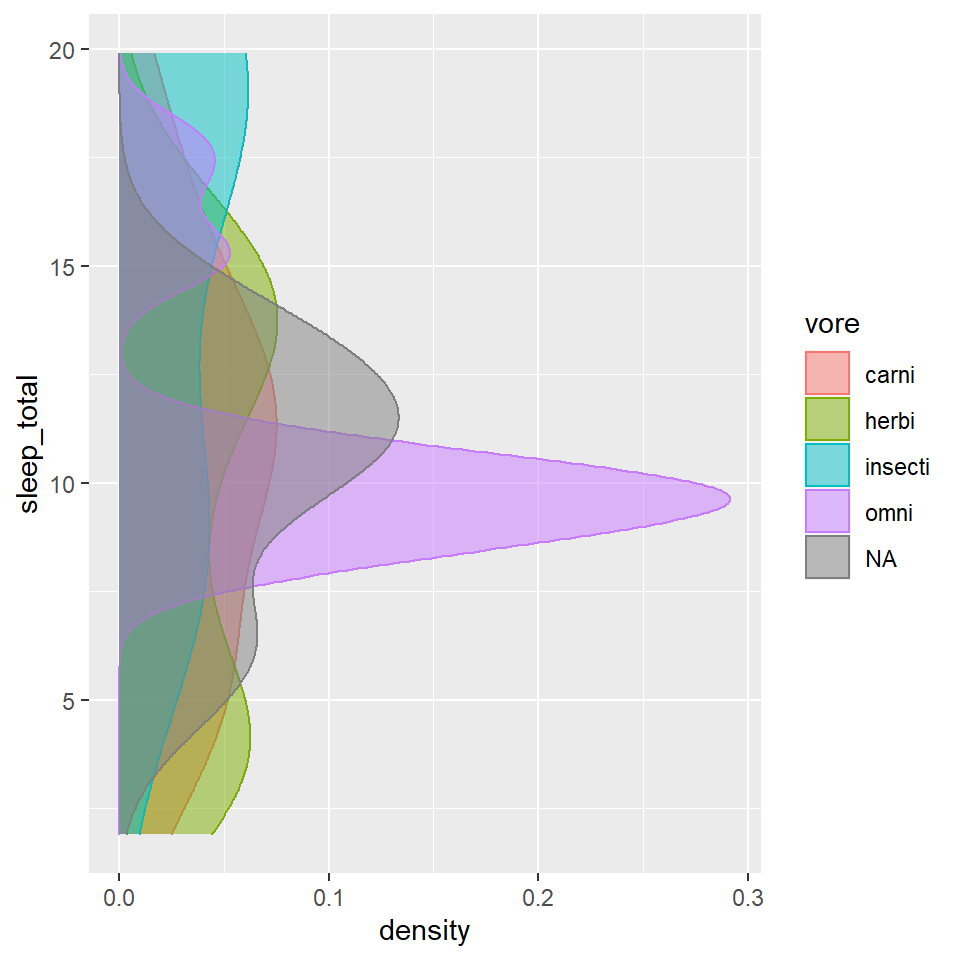
The graph shows the the different sleep patterns.
This graph is about the the number of hours animals sleep in a day. FUN FACT: I don’t get to sleep for 4 hours straight. p.s.: These mammals are lucky I must say. huh.
ggplot(msleep) + geom_line(aes(sleep_cycle, sleep_total, group= vore, color= vore))## Warning: Removed 51 row(s) containing missing values (geom_path).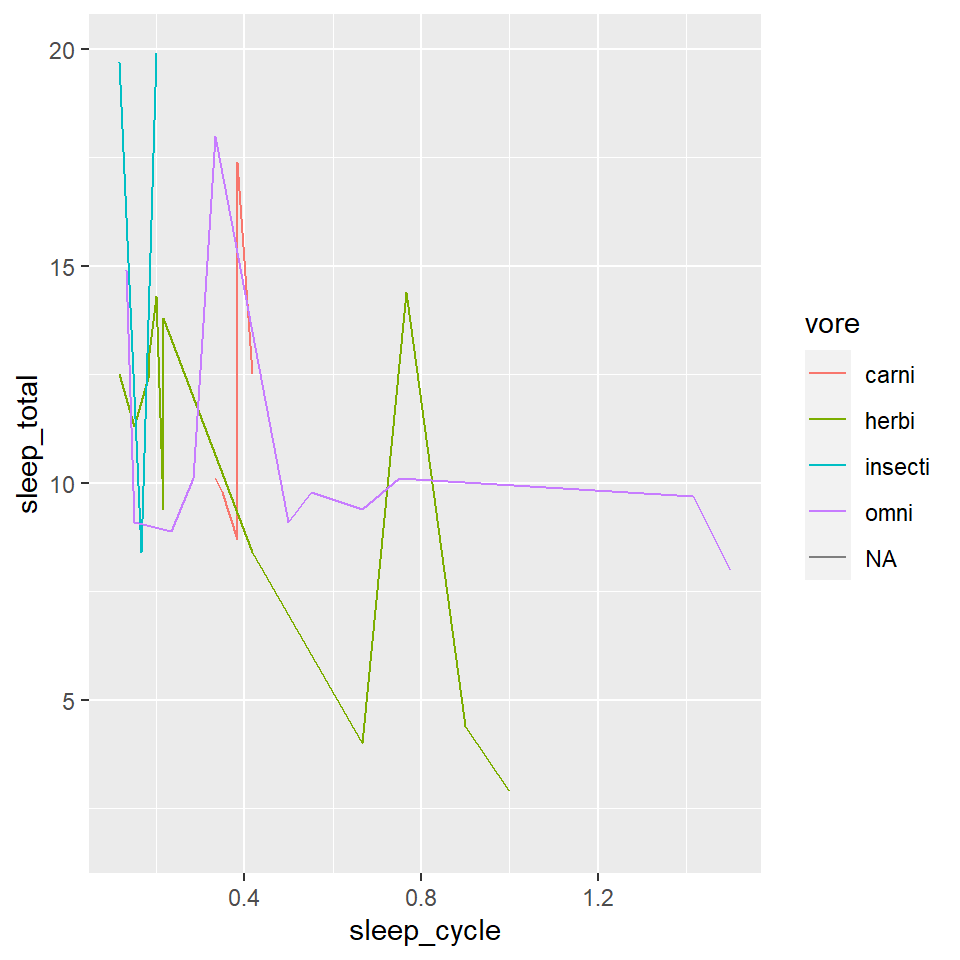
Graph 3
This dataset is about the diamonds. Related to color and carat.
ggplot(diamonds,
       mapping = aes(x = color,
           y = x)) +
  geom_point() +
  geom_smooth(method = "lm")
## `geom_smooth()` using formula 'y ~ x'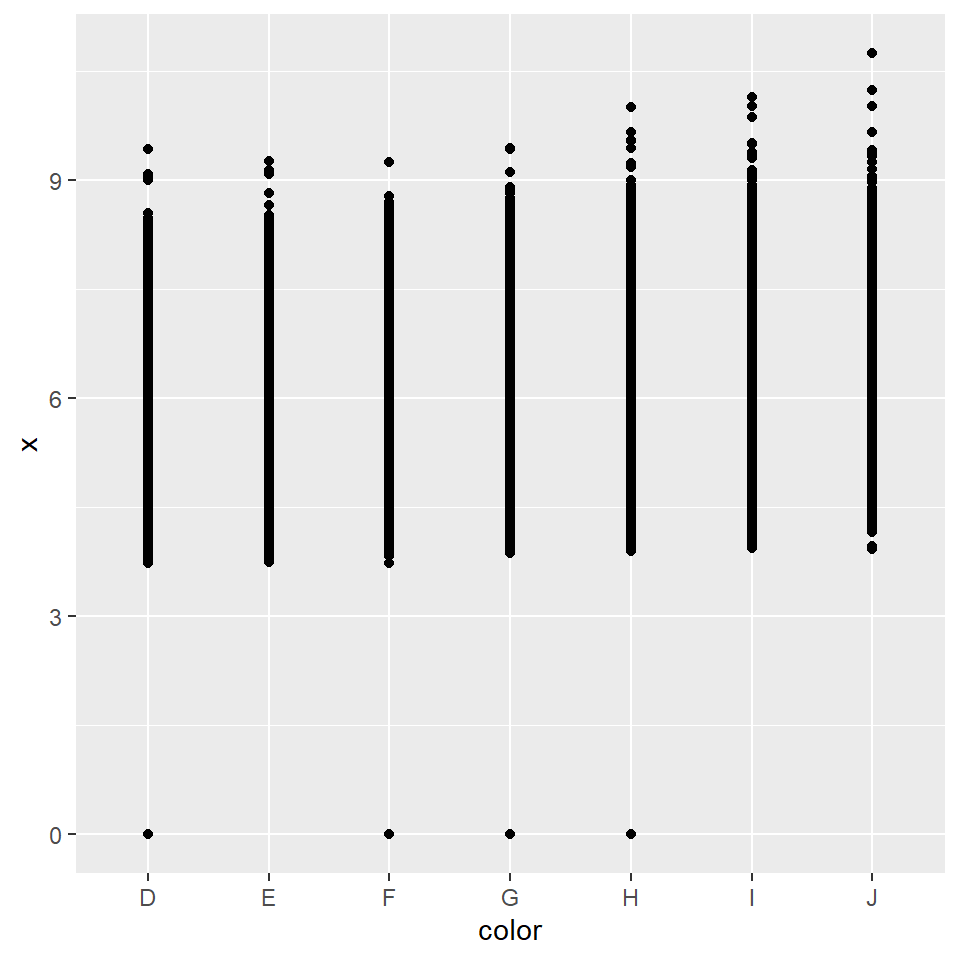
ggplot(diamonds,
       mapping = aes(x = carat,
           y = z)) +
  geom_point() +
  geom_smooth(method = "lm")
## `geom_smooth()` using formula 'y ~ x'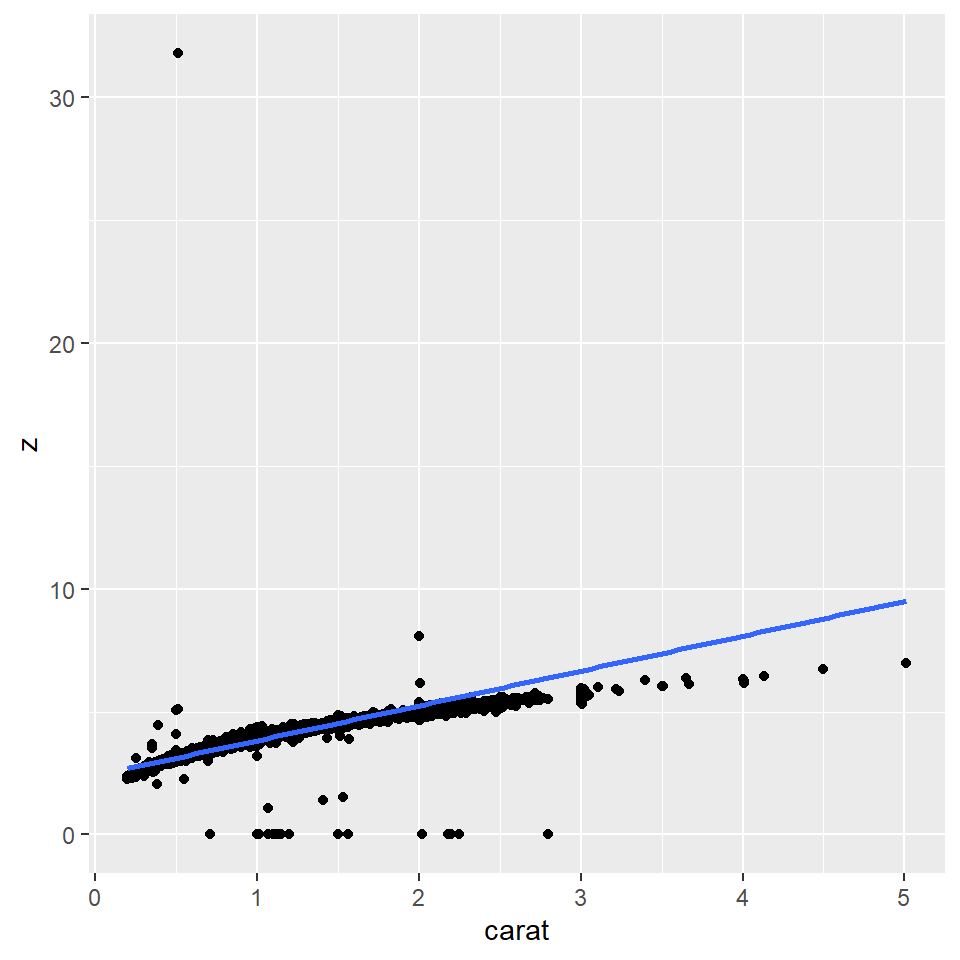
My Course Reflection
This course was all about patience and sitting still on your chair and work with keen eyes cause one single comma will ruin your whole work. It was a fun workshop. Arvind made it much easy than i thought. Definitely helped me with the patience thing.
Thank you.