Ishita Sabharwal
Graph No 1.
In this graph, we’ve explored a total of three variables, i.e., clarity, cut and the price of the diamonds dataset. Using the RColorBrewer package, colours have also been added. Via LAB04
ggplot(diamonds) + geom_point(aes(x = clarity, y = price, color = cut), size = 3) + scale_colour_viridis_d(option = "inferno") + labs(title = "Viridis Palette", subtitle = "Option Inferno") + facet_wrap(~cut)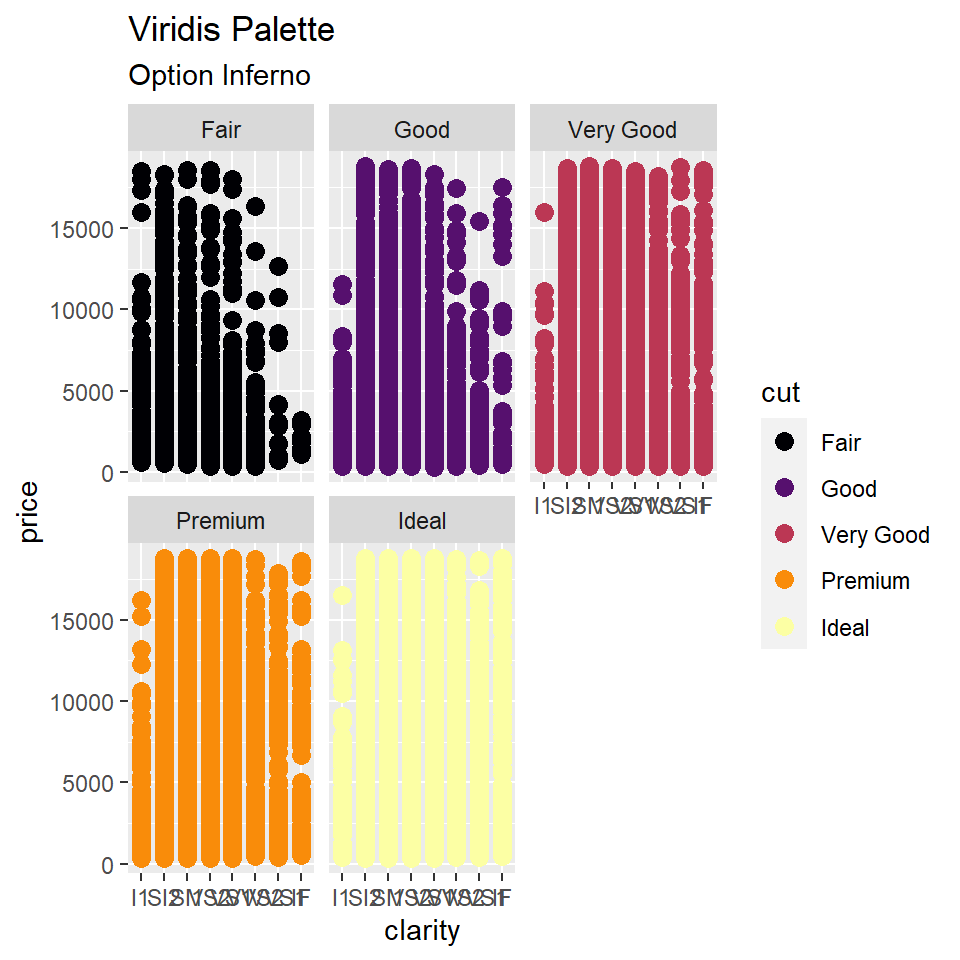
Graph No 2.
Adding the longitude and latitude of Delhi to create maps of my surrounding areas
bbox <- osmplotr::get_bbox(c(77.10,28.66,77.17,28.70))

bbox_l <- osmdata::getbb("Delhi, India")
#bbox_p <- prettymapr::searchbbox("Delhi, India")
dat_B <- extract_osm_objects (key = 'building', bbox = bbox) ## Issuing query to Overpass API ...## Rate limit: 2## Query complete!## converting OSM data to sf formatdat_H <- extract_osm_objects (key = 'highway', bbox = bbox)## Issuing query to Overpass API ...## Rate limit: 2## Query complete!## converting OSM data to sf formatdat_P <- extract_osm_objects (key = 'park', bbox = bbox)## Issuing query to Overpass API ...## Rate limit: 2## Query complete!## converting OSM data to sf formatdat_G <- extract_osm_objects (key = 'landuse', value = 'grass', bbox = bbox)## Issuing query to Overpass API ...## Rate limit: 2## Query complete!## converting OSM data to sf format## Warning in extract_osm_objects(key = "landuse", value = "grass", bbox = bbox):
## No valid data returned. (Maybe try a different 'return_type')dat_T <- extract_osm_objects (key = 'natural', value = 'tree', bbox = bbox,return_type = "point")## Issuing query to Overpass API ...## Rate limit: 2## Query complete!## converting OSM data to sf format## Warning in extract_osm_objects(key = "natural", value = "tree", bbox = bbox, :
## No valid data returned. (Maybe try a different 'return_type')dat_R <- extract_osm_objects(bbox = bbox, key = "amenity", value = "restaurant", return_type = "point") ## Issuing query to Overpass API ...## Rate limit: 2## Query complete!## converting OSM data to sf formattmap_mode("plot")## tmap mode set to plottingGraph No2.
Using the data from around my lacation, plotting graphs of various features. Via LAB06
#1
tm_shape(dat_B) + tm_bubbles(col = "red") +

#2
  tm_shape(dat_H) + tm_lines(col = "black", lwd = 1) +

#3
  tm_shape(dat_R) + tm_dots(size = 3, col = "yellow", shape = 21) + tm_text("name", auto.placement = TRUE) +
  tm_compass(type = "rose", position = c("right", "top")) + tm_scale_bar(width = 1, position = c("right", "bottom")) +
   labs(title = "It's a bloody red city")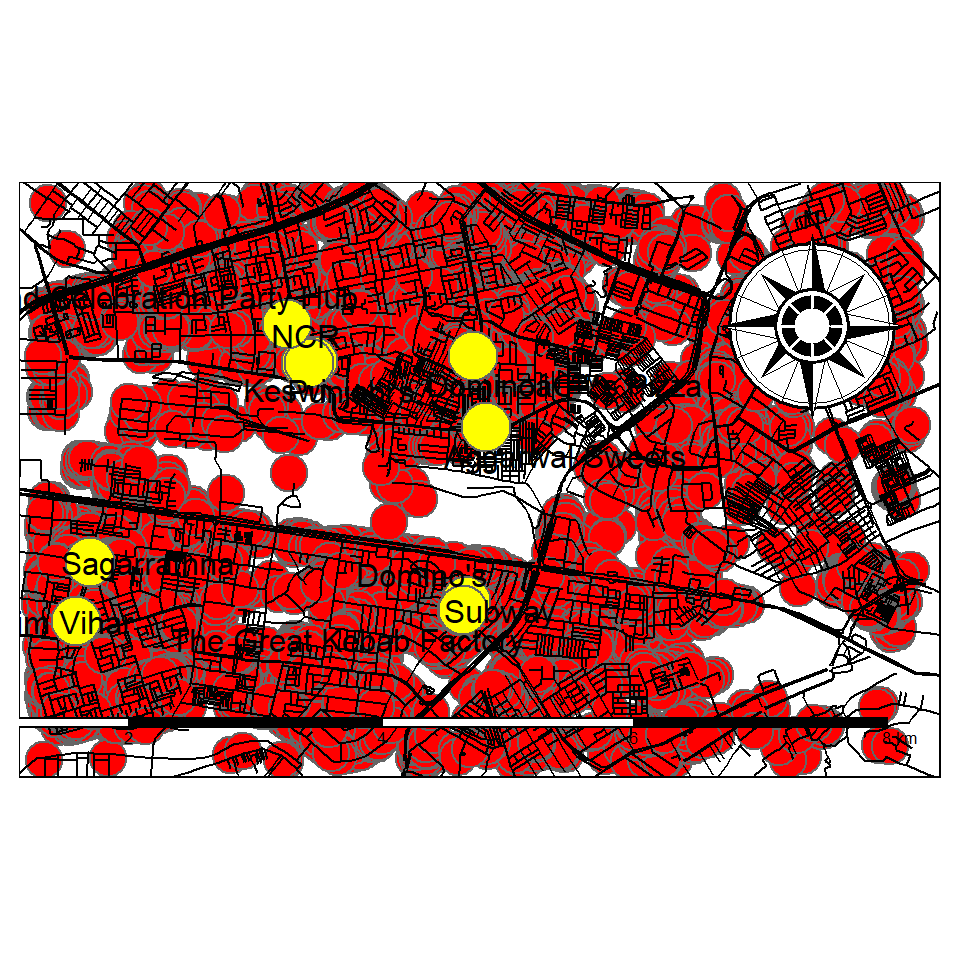
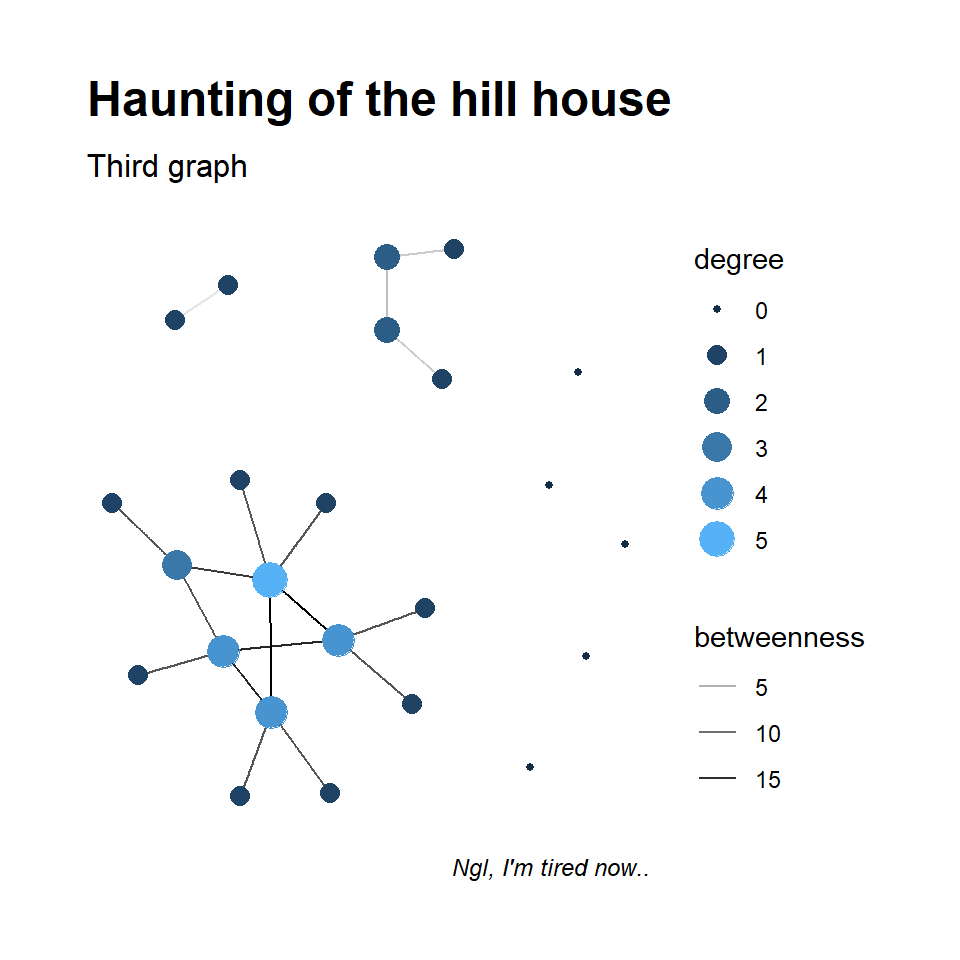
Graph No 3.
*SETUP-Reading data
hillhouse_nodes <- read_csv("data/hillhouse-nodes.csv")##
## -- Column specification --------------------------------------------------------
## cols(
## name = col_character(),
## sex = col_character(),
## race = col_character(),
## birthyear = col_double(),
## position = col_character(),
## haircolour = col_character(),
## sign = col_character()
## )hillhouse_nodes## # A tibble: 24 x 7
## name sex race birthyear position haircolour sign
## <chr> <chr> <chr> <dbl> <chr> <chr> <chr>
## 1 Eleanor Crain Vance F White 1986 Daughter brown Pisces
## 2 Theodora Crain F White 1982 Daughter brownblack Libra
## 3 Hugh Desmond Lester Crain M White 1959 Father brownblack Aquarius
## 4 Olivia Crain F White 1982 Mother brownblack Virgo
## 5 Shirley Crain Harris F White 1980 Daughter brown Aquarius
## 6 Steven Crain M White 1979 Son brown Aries
## 7 Luke Crain M White 1986 Son brownblack Pisces
## 8 Poppy Hill F White NA Ghost Burgundy <NA>
## 9 Clara Dudley F White NA Maid black <NA>
## 10 Kevin Harris M White 1975 Other black <NA>
## # ... with 14 more rowshillhouse_edges <- read_csv("data/hillhouse-edges.csv")##
## -- Column specification --------------------------------------------------------
## cols(
## from = col_character(),
## to = col_character(),
## type = col_character(),
## ID = col_double()
## )hillhouse_edges## # A tibble: 18 x 4
## from to type ID
## <chr> <chr> <chr> <dbl>
## 1 Theodora Crain Trish Park benefits 1
## 2 Shirley Crain Harris Kevin Harris married 2
## 3 Luke Crain Abigail friends 3
## 4 Luke Crain Joey friends 4
## 5 Hugh Desmond Lester Crain Olivia Crain married 5
## 6 Steven Crain Leigh Crain married 6
## 7 Clara Dudley Horace Dudley married 7
## 8 Ryan Quale Shirley Crain Harris benefits 8
## 9 Jayden Harris Allie Harris siblings 9
## 10 Olivia Crain Clara Dudley owners 10
## 11 Theodora Crain Dr. John Montague associates 11
## 12 Shirley Crain Harris Theodora Crain siblings 12
## 13 Steven Crain Shirley Crain Harris siblings 13
## 14 Eleanor Crain Vance Luke Crain twins 14
## 15 Eleanor Crain Vance Steven Crain siblings 15
## 16 Theodora Crain Eleanor Crain Vance siblings 16
## 17 Luke Crain Shirley Crain Harris siblings 17
## 18 Eleanor Crain Vance Arthur Vance married 18ga <- tbl_graph(nodes = hillhouse_nodes,
edges = hillhouse_edges,
directed = FALSE)
ga## # A tbl_graph: 24 nodes and 18 edges
## #
## # An undirected simple graph with 8 components
## #
## # Node Data: 24 x 7 (active)
## name sex race birthyear position haircolour sign
## <chr> <chr> <chr> <dbl> <chr> <chr> <chr>
## 1 Eleanor Crain Vance F White 1986 Daughter brown Pisces
## 2 Theodora Crain F White 1982 Daughter brownblack Libra
## 3 Hugh Desmond Lester Crain M White 1959 Father brownblack Aquarius
## 4 Olivia Crain F White 1982 Mother brownblack Virgo
## 5 Shirley Crain Harris F White 1980 Daughter brown Aquarius
## 6 Steven Crain M White 1979 Son brown Aries
## # ... with 18 more rows
## #
## # Edge Data: 18 x 4
## from to type ID
## <int> <int> <chr> <dbl>
## 1 2 13 benefits 1
## 2 5 10 married 2
## 3 7 15 friends 3
## # ... with 15 more rowsGraph No3.
A different graph style - set graph Via LAB07
set_graph_style()

ga %>%
  activate(nodes) %>%
  mutate(degree = centrality_degree()) %>%
  activate(edges) %>%
  mutate(betweenness = centrality_edge_betweenness()) %>%
  ggraph(layout = "nicely") +
  geom_edge_link(aes(alpha = betweenness)) +
  geom_node_point(aes(size = degree, colour = degree)) +
  #facet_graph(type ~ race) +
  scale_color_gradient(guide = "legend") +
  labs(title = "Haunting of the hill house", subtitle = "Third graph", caption = "Ngl, I'm tired now..")
## Warning in grid.Call(C_stringMetric, as.graphicsAnnot(x$label)): font family not
## found in Windows font database
## Warning in grid.Call(C_stringMetric, as.graphicsAnnot(x$label)): font family not
## found in Windows font database## Warning in grid.Call(C_textBounds, as.graphicsAnnot(x$label), x$x, x$y, : font
## family not found in Windows font database
## Warning in grid.Call(C_textBounds, as.graphicsAnnot(x$label), x$x, x$y, : font
## family not found in Windows font database## Warning in grid.Call(C_stringMetric, as.graphicsAnnot(x$label)): font family not
## found in Windows font database
## Warning in grid.Call(C_stringMetric, as.graphicsAnnot(x$label)): font family not
## found in Windows font database

## Warning in grid.Call(C_stringMetric, as.graphicsAnnot(x$label)): font family not
## found in Windows font database
## Warning in grid.Call(C_textBounds, as.graphicsAnnot(x$label), x$x, x$y, : font
## family not found in Windows font database
## Warning in grid.Call(C_textBounds, as.graphicsAnnot(x$label), x$x, x$y, : font
## family not found in Windows font database

## Warning in grid.Call(C_textBounds, as.graphicsAnnot(x$label), x$x, x$y, : font
## family not found in Windows font database
## Warning in grid.Call(C_textBounds, as.graphicsAnnot(x$label), x$x, x$y, : font
## family not found in Windows font database
## Warning in grid.Call(C_textBounds, as.graphicsAnnot(x$label), x$x, x$y, : font
## family not found in Windows font database
## Warning in grid.Call(C_textBounds, as.graphicsAnnot(x$label), x$x, x$y, : font
## family not found in Windows font database
## Warning in grid.Call(C_textBounds, as.graphicsAnnot(x$label), x$x, x$y, : font
## family not found in Windows font database
## Warning in grid.Call(C_textBounds, as.graphicsAnnot(x$label), x$x, x$y, : font
## family not found in Windows font database
## Warning in grid.Call(C_textBounds, as.graphicsAnnot(x$label), x$x, x$y, : font
## family not found in Windows font database
## Warning in grid.Call(C_textBounds, as.graphicsAnnot(x$label), x$x, x$y, : font
## family not found in Windows font database
## Warning in grid.Call(C_textBounds, as.graphicsAnnot(x$label), x$x, x$y, : font
## family not found in Windows font database
## Warning in grid.Call(C_textBounds, as.graphicsAnnot(x$label), x$x, x$y, : font
## family not found in Windows font database
## Warning in grid.Call(C_textBounds, as.graphicsAnnot(x$label), x$x, x$y, : font
## family not found in Windows font database