Prisha Jhaveri
Introduction
Hi! I’m Prisha, and today I’ll be showing you a glimpse into what I’ve learnt in this workshop as we fell down the rabbit hole of R-studio.
Graph 1
This is a dataset talking about the different features of a group of diamonds.
glimpse(diamonds)## Rows: 53,940
## Columns: 10
## $ carat <dbl> 0.23, 0.21, 0.23, 0.29, 0.31, 0.24, 0.24, 0.26, 0.22, 0.23, 0.~
## $ cut <ord> Ideal, Premium, Good, Premium, Good, Very Good, Very Good, Ver~
## $ color <ord> E, E, E, I, J, J, I, H, E, H, J, J, F, J, E, E, I, J, J, J, I,~
## $ clarity <ord> SI2, SI1, VS1, VS2, SI2, VVS2, VVS1, SI1, VS2, VS1, SI1, VS1, ~
## $ depth <dbl> 61.5, 59.8, 56.9, 62.4, 63.3, 62.8, 62.3, 61.9, 65.1, 59.4, 64~
## $ table <dbl> 55, 61, 65, 58, 58, 57, 57, 55, 61, 61, 55, 56, 61, 54, 62, 58~
## $ price <int> 326, 326, 327, 334, 335, 336, 336, 337, 337, 338, 339, 340, 34~
## $ x <dbl> 3.95, 3.89, 4.05, 4.20, 4.34, 3.94, 3.95, 4.07, 3.87, 4.00, 4.~
## $ y <dbl> 3.98, 3.84, 4.07, 4.23, 4.35, 3.96, 3.98, 4.11, 3.78, 4.05, 4.~
## $ z <dbl> 2.43, 2.31, 2.31, 2.63, 2.75, 2.48, 2.47, 2.53, 2.49, 2.39, 2.~I randomly selected a group of point from the aforementioned dataset, and used it to plot a graph to understand the trends in the cut, carat and prices of diamonds:
diamonds %>%
  slice_sample(prop = 0.2) %>%
  ggplot(., aes(x = carat, y = price, colour = cut)) +
  geom_point(size = 1) +
               scale_colour_viridis_d(option = "magma") +
  geom_smooth(method = "lm") +
  labs(title = "How does the carat and cut affect the price?",
       subtitle = "corelation graph")
## `geom_smooth()` using formula 'y ~ x'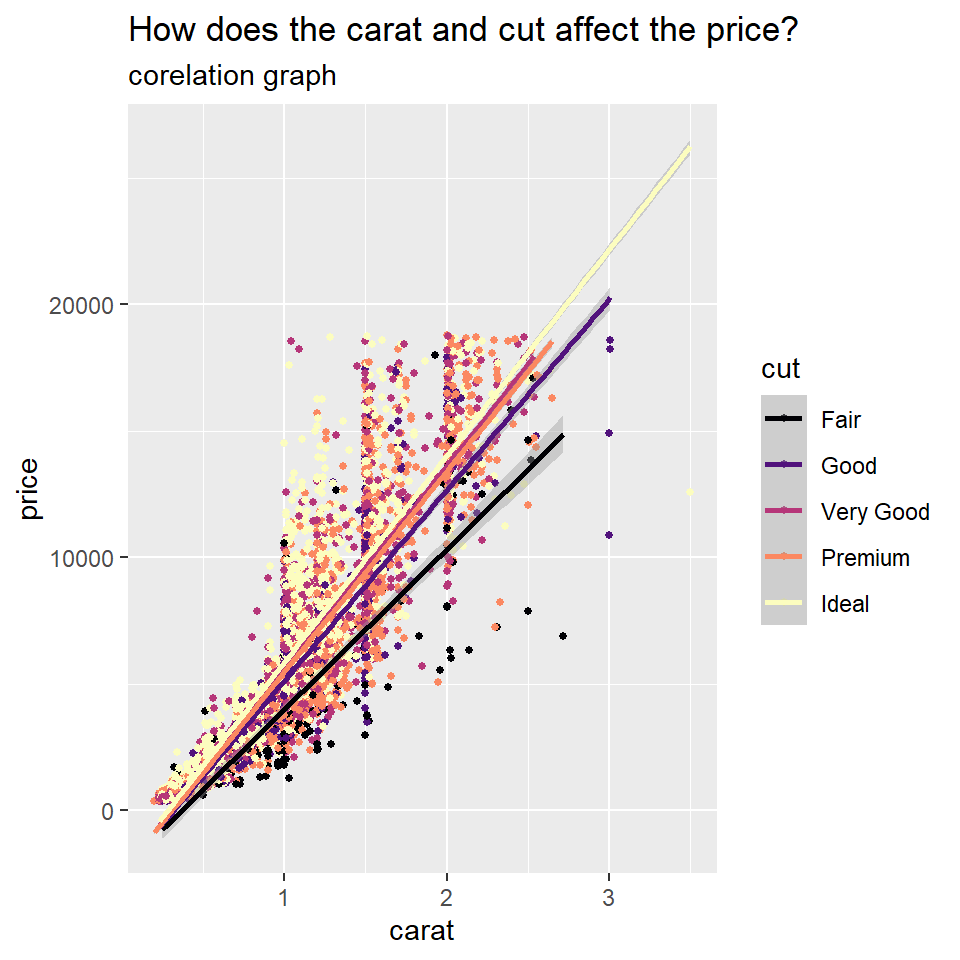 The price was higher with larger carats. There is an uoward trend with the cuts too.
Graph 2
In this section, we learnt how to fetch coordinates and data about specific places, and use it to create a map. I created the map of New Delhi, and marked where the roads, buildings, schools and restaurants were.
bbox_delhi <- prettymapr::searchbbox("New Delhi, Delhi, India")## Using default API key for pickpoint.io. If batch geocoding, please get your own (free) API key at https://app.pickpoint.io/sign-upbbox_delhi## min max
## x 77.05037 77.25514
## y 28.48126 28.64568dat_delhi_B <- extract_osm_objects (bbox_delhi, key = "building") ## Issuing query to Overpass API ...## Rate limit: 2## Query complete!## converting OSM data to sf formatdat_delhi_H <- extract_osm_objects (bbox_delhi, key = "highway")## Issuing query to Overpass API ...## Rate limit: 2## Query complete!## converting OSM data to sf formatdat_delhi_R <- extract_osm_objects(bbox_delhi,
key = "amenity",
value = "restaurant",
return_type = "point") #<<## Issuing query to Overpass API ...## Rate limit: 2## Query complete!## converting OSM data to sf formatdat_delhi_S <- extract_osm_objects(bbox_delhi,
key = "amenity",
value = "school",
return_type = "point") #<<## Issuing query to Overpass API ...## Rate limit: 2## Query complete!## converting OSM data to sf formattm_shape(dat_delhi_B) +
tm_fill(col = "darkgreen") +
tm_shape(dat_delhi_H) +
tm_lines(col = "blueviolet") +
tm_shape(dat_delhi_R) +
tm_dots(size = 1, col = "seagreen2", shape= 10) +
tm_shape(dat_delhi_S) +
tm_dots(size = 1, col = "pink", shape= 10) +
tm_compass(type = "rose", position= c("right", "top")) +
tm_scale_bar(width = 4, position = c("left", "bottom"), text.size = 1) +
tm_layout(title = "New Delhi", title.size = 3, frame = TRUE, frame.lwd = 5, bg.color = "lightyellow") +
tm_add_legend(type = "symbol", col = "pink",
title="Schools")+
tmap_style("watercolor")## tmap style set to "watercolor"## other available styles are: "white", "gray", "natural", "cobalt", "col_blind", "albatross", "beaver", "bw", "classic"## Scale bar width set to 0.25 of the map width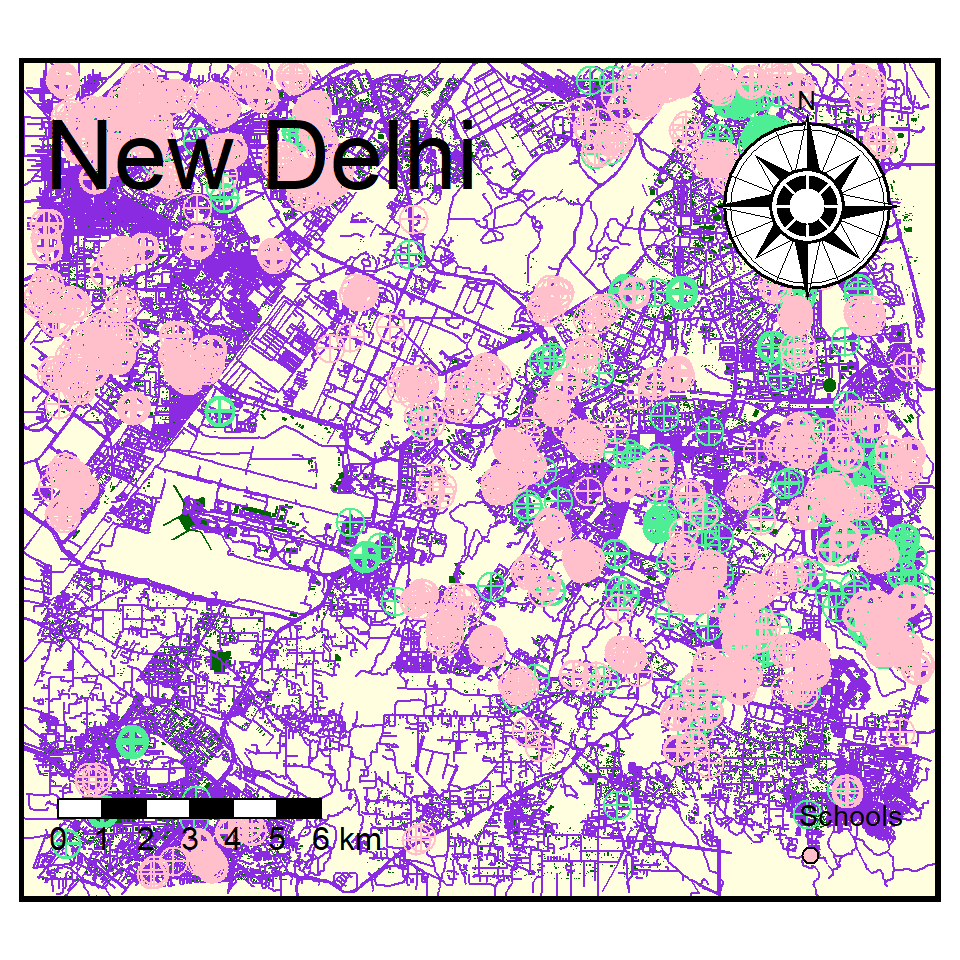 guide:
Pink- school
Green- restaurants
Dark Green- buildings
Purple- roads
guide:
Pink- school
Green- restaurants
Dark Green- buildings
Purple- roads
Graph 3
For my last graph I wanted to show you an interactive network I made using the characters and their relationship with each other in the show Family Guy.
familyguy_nodes <- read_delim(delim = ",", "./Data/familyguy-nodes.csv" )## Rows: 19 Columns: 3## -- Column specification --------------------------------------------------------
## Delimiter: ","
## chr (3): Names, Sex, Job##
## i Use `spec()` to retrieve the full column specification for this data.
## i Specify the column types or set `show_col_types = FALSE` to quiet this message.familyguy_edges <- read_delim(delim = ",", "./Data/familyguy-edges.csv")## Rows: 60 Columns: 4## -- Column specification --------------------------------------------------------
## Delimiter: ","
## chr (3): To, From, Type
## dbl (1): Weight##
## i Use `spec()` to retrieve the full column specification for this data.
## i Specify the column types or set `show_col_types = FALSE` to quiet this message.familyguy_nodes## # A tibble: 19 x 3
## Names Sex Job
## <chr> <chr> <chr>
## 1 Lois F Pianist
## 2 Brian M writer
## 3 Peter M desk job
## 4 Stewie M baby
## 5 Chris M student
## 6 Meg F student
## 7 Ronald Raegan M ex-president
## 8 Quagmire M pilot
## 9 Joe M police
## 10 Jerome M pub
## 11 clone N/A lackey
## 12 B-clone N/A lackey
## 13 Candy F makeup school
## 14 Receptionist F office
## 15 Kevin Conolly M actor
## 16 Horace M Bartender
## 17 Baby F baby
## 18 flintstones M gag
## 19 cops N/A gagfamilyguy_edges## # A tibble: 60 x 4
## To From Weight Type
## <chr> <chr> <dbl> <chr>
## 1 Peter Quagmire 5 friends
## 2 Lois Peter 10 family
## 3 Chris Meg 8 family
## 4 flintstones cops 1 gag
## 5 Chris Peter 8 family
## 6 Peter Ronald Raegan 5 gag
## 7 Quagmire Peter 5 friends
## 8 Stewie Brian 9 family
## 9 Stewie clone 2 experiment
## 10 Brian clone 1 experiment
## # ... with 50 more rowsfg <- tbl_graph(nodes = familyguy_nodes,
edges = familyguy_edges,
directed = FALSE)
fg## # A tbl_graph: 19 nodes and 60 edges
## #
## # An undirected multigraph with 2 components
## #
## # Node Data: 19 x 3 (active)
## Names Sex Job
## <chr> <chr> <chr>
## 1 Lois F Pianist
## 2 Brian M writer
## 3 Peter M desk job
## 4 Stewie M baby
## 5 Chris M student
## 6 Meg F student
## # ... with 13 more rows
## #
## # Edge Data: 60 x 4
## from to Weight Type
## <int> <int> <dbl> <chr>
## 1 3 8 5 friends
## 2 1 3 10 family
## 3 5 6 8 family
## # ... with 57 more rowslibrary(visNetwork)
familyguy_nodes## # A tibble: 19 x 3
## Names Sex Job
## <chr> <chr> <chr>
## 1 Lois F Pianist
## 2 Brian M writer
## 3 Peter M desk job
## 4 Stewie M baby
## 5 Chris M student
## 6 Meg F student
## 7 Ronald Raegan M ex-president
## 8 Quagmire M pilot
## 9 Joe M police
## 10 Jerome M pub
## 11 clone N/A lackey
## 12 B-clone N/A lackey
## 13 Candy F makeup school
## 14 Receptionist F office
## 15 Kevin Conolly M actor
## 16 Horace M Bartender
## 17 Baby F baby
## 18 flintstones M gag
## 19 cops N/A gagfamilyguy_edges## # A tibble: 60 x 4
## To From Weight Type
## <chr> <chr> <dbl> <chr>
## 1 Peter Quagmire 5 friends
## 2 Lois Peter 10 family
## 3 Chris Meg 8 family
## 4 flintstones cops 1 gag
## 5 Chris Peter 8 family
## 6 Peter Ronald Raegan 5 gag
## 7 Quagmire Peter 5 friends
## 8 Stewie Brian 9 family
## 9 Stewie clone 2 experiment
## 10 Brian clone 1 experiment
## # ... with 50 more rowsfamilyguy_nodes_vis <- familyguy_nodes %>%
rowid_to_column(var = "id") %>%
rename("label" = Names) %>%
mutate(sex = case_when(Sex == "F" ~ "Female",
Sex == "M" ~ "Male",
Sex == "N/A" ~ "Not Applicable")) %>%
replace_na(., list(Sex = "Transgender?")) %>%
dplyr::rename("group" = Sex)
familyguy_nodes_vis## # A tibble: 19 x 5
## id label group Job sex
## <int> <chr> <chr> <chr> <chr>
## 1 1 Lois F Pianist Female
## 2 2 Brian M writer Male
## 3 3 Peter M desk job Male
## 4 4 Stewie M baby Male
## 5 5 Chris M student Male
## 6 6 Meg F student Female
## 7 7 Ronald Raegan M ex-president Male
## 8 8 Quagmire M pilot Male
## 9 9 Joe M police Male
## 10 10 Jerome M pub Male
## 11 11 clone N/A lackey Not Applicable
## 12 12 B-clone N/A lackey Not Applicable
## 13 13 Candy F makeup school Female
## 14 14 Receptionist F office Female
## 15 15 Kevin Conolly M actor Male
## 16 16 Horace M Bartender Male
## 17 17 Baby F baby Female
## 18 18 flintstones M gag Male
## 19 19 cops N/A gag Not Applicablefamilyguy_edges_vis <- familyguy_edges %>%
select(From, To) %>%
left_join(., familyguy_nodes_vis, by = c("From" = "label")) %>%
left_join(., familyguy_nodes_vis, by = c("To" = "label")) %>%
select("From"= id.x, "To" = id.y) %>%
rename("to" = To, "from"= From)
familyguy_edges_vis## # A tibble: 60 x 2
## from to
## <int> <int>
## 1 8 3
## 2 3 1
## 3 6 5
## 4 19 18
## 5 3 5
## 6 7 3
## 7 3 8
## 8 2 4
## 9 11 4
## 10 11 2
## # ... with 50 more rowsfamilyguy_nodes_vis %>%
visNetwork(nodes = ., edges = familyguy_edges_vis) %>%
visNodes(font = list(size = 40)) %>%
visGroups(groupname = "F", shape = "icon",
icon = list(code = "f182", size = 75, color = "tomato"),
shadow = list(enabled = TRUE)) %>%
visGroups(groupname = "M", shape = "icon",
icon = list(code = "f183", size = 75, color = "slateblue"),
shadow = list(enabled = TRUE)) %>%
visGroups(groupname = "N/A", shape = "icon",
icon = list(code = "f22c", size = 75, color = "fuchsia"),
shadow = list(enabled = TRUE)) %>%
addFontAwesome() %>%
visInteraction(navigationButtons = TRUE,
hover = TRUE,
selectConnectedEdges = TRUE,
hoverConnectedEdges = TRUE,
zoomView = TRUE) My Course Reflection
This workshop was something completely new for me. Coding isn’t my forte, but this class was really enjoyable for me- especially with the patience with which Arvind would teach us a code over and over again. I learnt how numbers and graphs can be translated to patterns and trends that can tell us so much more about it, and it also taught me the importance of design in tables and graphs. This is going to make me look at how I can include analysis, patterns and data into my work from an all new, digital perspective. It can also help me present my work, and include interactive code in it in a new way!
I really enjoyed this class, and I hope I can explore this further.